My Elastic Search
Projects
Back to main page
Project 1: Elasticsearch
TLS Encryption HTTPS Communication
https://isc.sans.edu/forums/diary/Secure+Communication+using+TLS+in+Elasticsearch/26902/
This
document is a compilation of the various references listed in this document; it
combines all the necessary steps I used to setup TLS
encryption. Using Elasticsearch elasticsearch-certutil
self-signed certificate authority, it provides secure communication for Linux
and Windows between Elasticsearch nodes, Kibana, logstash
and the various beats.
The
complete installation document TLS_elasticsearch_configuration.pdf is located here.
Project 2: Building IDS
Sensor with Suricata & Zeek with Logs to Elasticsearch
Follow the
steps listed in this document to build the sensor. This Internet Storm Center
(SANS ISC) provides a summary to quickly install the sensor.
ISC Diary: https://isc.sans.edu/diary/27296
Installation
Document : https://handlers.sans.edu/gbruneau/elk/Building_Custom_IDS_Sensor.pdf
The primary goal of this document is to provide a framework to build your own sensor(s) using CentOS 7 with Suricata and Zeek. It also has information to capture netflow data using softflowd. The two tarball listed below, are used to preconfigure the sensor after CentOS7 has been installed with the two /nsm partitions. It includes configuration scripts, startup scripts and some partly configure .yml files for filebeat, metricbeat and packetbeat.
Note: Modify both these tarball and adapt them for your local network.
References:
[1] https://handlers.sans.edu/gbruneau/scripts/installation.tgz
[2] https://handlers.sans.edu/gbruneau/scripts/sensor.tgz
Project 3: Pihole Configuration Files
Configure /etc/filebeat/filebeat.yml as follow: filebeat.inputs:
- type: log enabled: true paths: - "/var/log/pihole.log" fields_under_root: true fields: region: Ottawa output.logstash:
hosts: ["127.0.0.1:5044"] Download the following logstash script to send logs to ELK. Adjust your Elastic IP accordingly. The pihole.conf file was updated using the Elastic Common Schema (ECS) Reference and the dashboard was updated accordingly. Logstash Pihole parser (Updated 20 Feb 2020)Pihole Dashboard (21 Feb 2020)
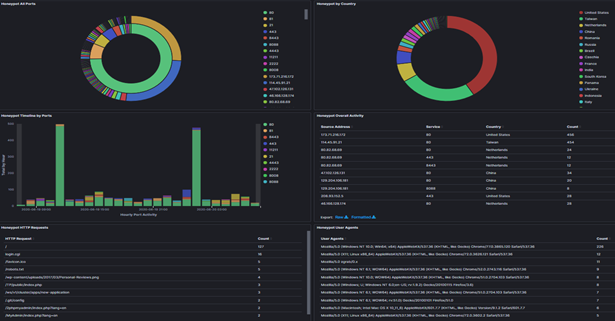
Project 4: tcp-honeypot Configuration Files
Configure /etc/filebeat/filebeat.yml as follow: filebeat.inputs:
- type: log enabled: true paths: - "/opt/logs/tcp-honeypot-*.log" fields_under_root: true fields: region: Ottawa output.logstash:
hosts: ["127.0.0.1:5044"]
Download the following logstash.yml script to send logs to ELK. Adjust your Elastic IP accordingly. His honeypot script is located here. Logstash tcp-honeypot (20 Jun 2020)tcp-honeypot Dashboard (20 Jun 2020)
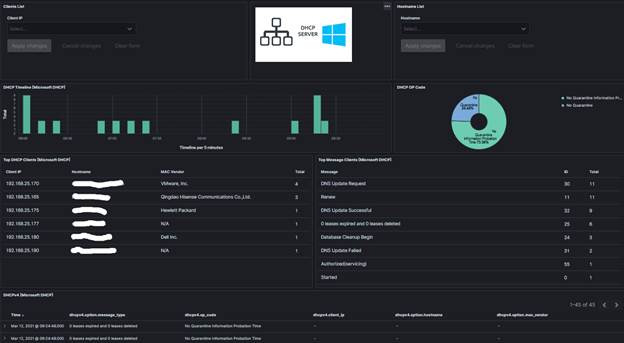
Project 5: Windows DHCP Server Logs Configuration Files
Note: See Post on https://isc.sans.edu/diary/27198
Configure /etc/filebeat/filebeat.yml as follow:
# This filebeat shipper is used with
# for Microsoft DHCP logs
# 9 Jan 2021
# Version: 1.0
filebeat.inputs:
# Filebeat input for Microsoft DHCP logs
- type: log
paths:
-
"C:/Windows/System32/dhcp/DhcpSrvLog-*.log"
include_lines:
["^[0-9]{2},"]
fields_under_root:
true
#==================== Queued Event ====================
#queue.mem:
# events: 4096
# flush.min_events:
512
# flush.timeout: 5s
#queue.disk:
# path:
"/op/filebeat/diskqueue"
# max_size:
10GB
#==================== Output Event ====================
output.logstash:
hosts:
["192.168.2.23:5044"]
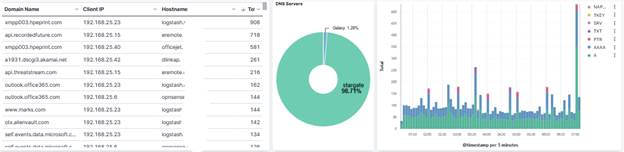
Download the following logstash script to send logs to ELK. Adjust your Elastic IP accordingly. The logstash-filter-dhcp.conf file was updated using the Elastic Common Schema (ECS) Reference and the dashboard was updated accordingly. Logstash Microsoft DHCP Parser (12 March 2021)Microsoft DHCP Dashboard (12 March 2021)Windows DHCP Template (10 September 2021)Windows DHCP ILM Policy (10 September 2021) Project 6: Windows DNS Server Logs Configuration Files
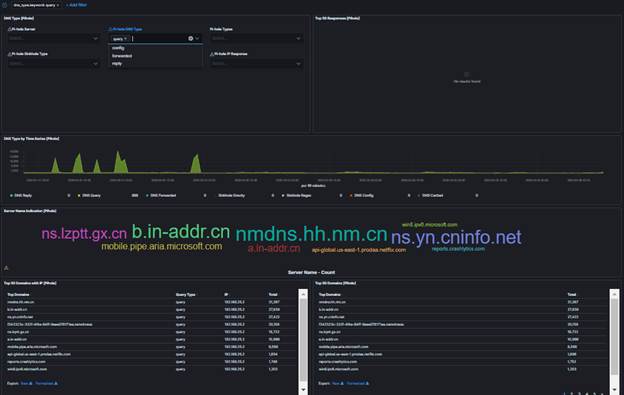
Note: See Post on https://isc.sans.edu/diary/27828
Configure DNS to Generate logs - File-based DNS debug logging
Login Windows server and setup file-based DNS debug logging. Windows DNS Debug Logging is used to collect the logs. Queries are logged one per line. Enable DNS debug logging using these steps:
· Create directory: C:\DNSLogs
· Open the DNS Management console (dnsmgmt.msc).
· Right-click on the DNS Server name and choose Properties from the context menu.
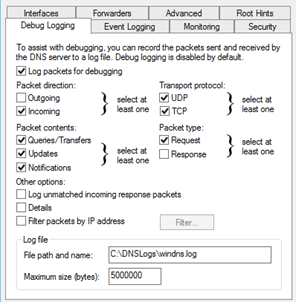
· Under the Debug Logging tab, enable Log packets for debugging and configure as per picture below.
· File path and name: C:\DNSLogs\windns.log
· Maximum size (bytes): 5000000
· Apply the changes
· Verify the file C:\DNSLogs\windns.log is now receiving data
Change the IP address in this file to the IP address (192.168.25.23) of the logstash service. Configure /etc/filebeat/filebeat.yml as follow:
# This filebeat shipper is used for # Microsoft DNS logs # 9 Jan 2021# Version: 1.0 filebeat.inputs:
# Filebeat input for Windows DNS logs - type: log paths: - "C:/DNSLogs/windns.log" include_lines: ["^[0-9]{4}-"] fields_under_root: true #==================== Queued Event ====================#queue.mem:# events: 4096# flush.min_events: 512# flush.timeout: 5s #queue.disk:# path: "/op/filebeat/diskqueue"# max_size: 10GB #==================== Output Event ====================output.logstash:
hosts: ["192.168.25.23:5044"] Download the following logstash script to send logs to ELK. Adjust your Elastic IP accordingly. This configuration file also contains the option of resolving the IP addresses to hostname and should be adjusted to reflect the local internal network. Edit logstash-filter-ms-dns.conf and change to the local network the 192.168.25: # This filter drop internal domain and internal IP range with in-addr.arpa# This reduce the amount of noisefilter { if [log][file][path] =~ "windns.log" { if [dns.question.name] =~ /168\.192\.in-addr\.arpa/ { drop {} } if [dns.question.name] =~ /erin\.ca/ { drop {} } }} # DNS lookup for dns.resolved_ip that start with 192.168.25 filter { if [log][file][path] =~ "windns.log" and [dns.resolved_ip] =~ /192\.168\.25/ { mutate { copy => { "dns.resolved_ip" => "source.registered_domain" } convert => { "geoip.postal_code" => "string" } # copy dns.question.name to related.host copy => { "dns.question.name" => "related.hosts" } } dns { reverse => [ "source.registered_domain" ] action => "replace" } }} The logstash-filter-ms-dns.conf file was updated using the Elastic Common Schema (ECS) Reference and the dashboard was updated accordingly. Logstash Microsoft DNS Parser (31 March 2023)Microsoft DNS Dashboard (31 March 2023)Windows DNS Template (31 March 2023)Windows DNS ILM Policy (31 March 2023)
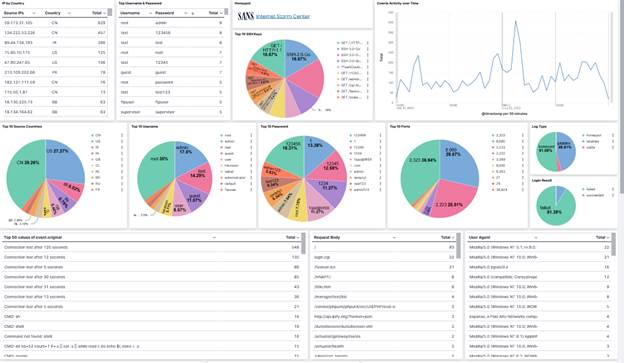
Project 6: DShield Sensor Log Parser
See DShield-SIEM for the docker package that will install all the required files to store your DShield sensor logs.
These are the files required to parse the DShield sensor logs to be ingested by Elasticsearch. 3 parsers exist, one for each type of logs.
· Firewall iptables logs
· Cowrie JSON logs
· Webhoneypot logs